Chapter 7: Backtesting Your Weighted QuickDog Handicapping Style
BACKTESTING - Definition - the use of historical results charts combined with your QuickDog selections to report on how well your method worked statistically.
Now that you've supplied your own "WEIGHTING FACTORS" to one of QuickDog 5 Handicapping Styles, how well does your personalized method work?
Without a computer program like QuickDog, you've gone back to last night's program, taken your picks and begun to scrutinize your method of picking the winners. This process can be time consuming, not to mention the fact that what you learn may or may not be applied to today's card. Consistency in approach is important when dealing with greyhounds because, unlike horses with jockeys, statistical methods can be applied to them. Any statistical method requires many, many instances of tests to discover patterns so that future results can be assumed more easily and confidently. When you place that next wager, don't you want to be confident that you've applied all your knowledge plus statistical analysis to that wager? And wouldn't it be nice if you could do both without hours of handicapping?
QuickDog Backtesting will supply you with the statistical data you need. And it will do it in seconds! That's why QuickDog will pay for itself over and over again during your subscription period.
Backtesting along with Wager Testing, covered in the next section, will allow you to "tune" your method based on your track, grade, distance, even evening or matinee performances. You will discover which factors are important over the course of time, and which can be ignored. All of this will result in a much greater knowledge than 80 to 90 percent of the patrons wagering at your race track.
Now, let's look at QuickDog Backtesting!
Once again, we are looking at the STANDARD METHOD with the CCe10-07e program. For simplicity, our initial Backtest will consist of ONLY the races on this card. This is not intended to be a very statistical approach because a statistical approach would require many programs and many races. This tutorial is designed to familiarize you with what information is available in Backtest. Later, after you've collected the necessary data, you can do the analysis of your handicapping method. And you'll do so quickly and easily using the QuickDog Backtest feature!
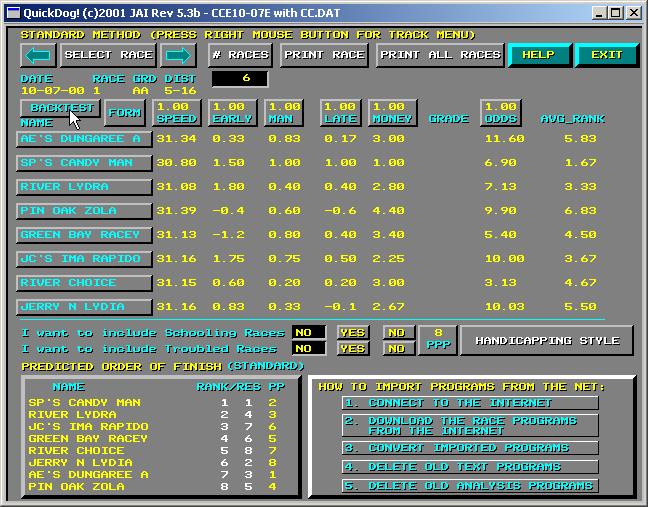
Now that you are familiar with selecting a program to look at, start up QuickDog and select the CCe10-07e program using the STANDARD METHOD. Depending on any WEIGHTING FACTOR changes you made, your display should look similar to this -
Figure 1 - Standard Handicapping Method - Cursor on BACKTEST Button
Note the CURSOR rests on the BACKTEST button. Click on BACKTEST and the following pop-up will appear.
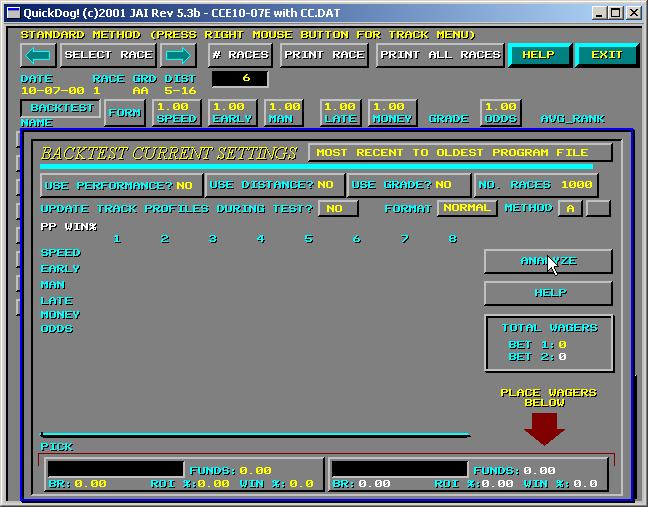
Figure 2 - The BACKTEST Pop-up
This pop-up, though small, contains a lot of information which you can change. The information is then used by QuickDog to select which types of races you wish to look at, and how you'd like the results to be displayed.
Let's being with the date range button that appears with the text - "MOST RECENT TO OLDEST PROGRAM FILE". This button is located at the top right of the BACKTEST pop-up. Click on this button and the following pop-up will appear.
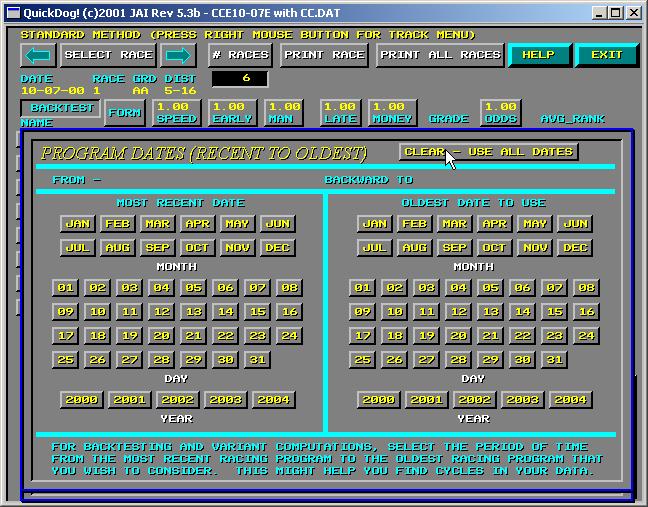
Figure 3 - PROGRAM DATES
QuickDog is entirely mouse driven and the data you need to enter is presented graphically with buttons to enter your data. This PROGRAM DATES pop-up will filter your backtest request by telling QuickDog to only consider programs from a date range you provide. Note that the date entered on the LEFT side represents the date of the MOST RECENT program date you wish to use, and the RIGHT side is the oldest program you will accept.
Keep in mind that statistical information changes over time for many reasons at tracks. Such things as attendance, knowledge of attendees, weather, etc., all have an effect on the various information that backtest will provide. Finding a trend doesn't mean that trend will hold up forever. Perhaps during the time period, many of the best players were taking a vacation, leaving more money to split amongst other players.
What we recommend is finding trends, but to be vigilant and look for new ones. This is done by changing this PROGRAM DATE display to apply your theories to different time periods. The better you theory performs over the greater time period, the more confident you can be that you will be successful. However, if you were to select only a week's worth of data, and base all your expectations there, you might be disappointed, however, you may also have discovered a new trend.
QuickDog will provide the tool, it's up to you to provide your own logical analysis of the data QuickDog produces, data which you'd never even see without a tool such as QuickDog.
For now, leave this display alone and simply RIGHT CLICK the Mouse to return to Figure 2. The only race program we are looking at is CCe10-07, so looking at ALL DATES will simply look at this program.
Returning our attention to Figure 2, let's look at the PERFORMANCE button in the upper left corner of the pop-up. Note, that by clicking on this button, you change the setting from YES to NO and vice versa. This button selection, if YES, tells QuickDog to only look at race programs of the same performance as the one you've selected with your current Handicapping Style. Since CCe10-07 is an EVENING PERFORMANCE, QuickDog will skip all programs which are afternoon or matinee performances at CC while backtesting. If you wish to backtest all performances, set PERFORMANCE to "NO".
Keep in mind that different types of people may come to afternoon races versus evening races, so this may or may not be significant. Whether it is, or is not will be demonstrated by the data QuickDog produces.
Next, to the right of PERFORMANCE is the DISTANCE button. Again, it may be set to YES or NO by clicking on it. Note that the race currently selected is a 5-16th race. Selecting DISTANCE - YES - would tell QuickDog that you only want to look at 5-16ths races during Backtest. Do you see how these buttons are used to filter races? Leave this setting "NO".
Let's go on to GRADE. Once again, note the GRADE of AA for this current race. If you set GRADE to YES, then only GRADE AA races will be looked at by QuickDog during this backtest.
Combining all three settings, you can have QuickDog look at only your favorite races to play. Perhaps you are playing the wrong races? QuickDog will show you, thereby saving you some money!
If you've selected "MOST RECENT TO OLDEST PROGRAM FILE", you may wish to limit the number of races used by providing an entry to the "NO. RACES" button. By entering this number you will limit the number of races QuickDog will use from the current date back. Once again, you are filtering races, quickly and easily, saving time and money, not to mention mental fatigue.
To enter the number of races, select this button and the following pop-up will appear.
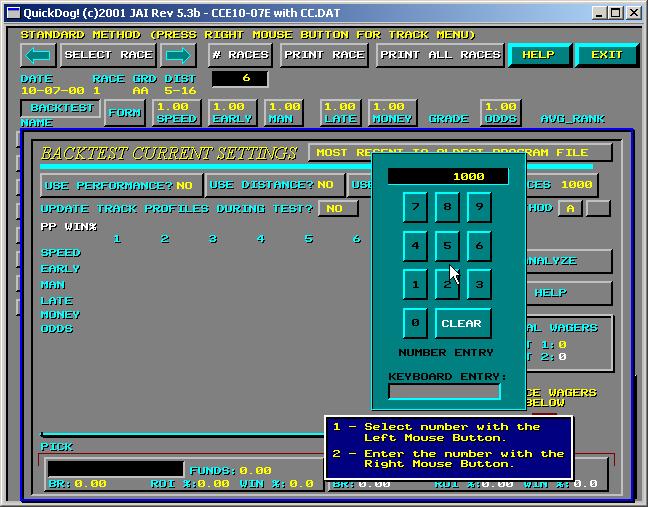
Figure 4 - Entering NO. RACES
You will notice the default value is 1000. When you enter a different number, this number will be saved for you and will not change unless you change it again. Enter a new number by clicking on the digits. Use the CLEAR button to start over, and press the RIGHT MOUSE BUTTON when finished. This will ENTER your number and return you to the Backtest pop-up. For this tutorial, you may simply skip this entry and press the RIGHT MOUSE BUTTON right away without entering anything.
For now, the two WAGER buttons at the bottom of the pop-up will be ignored. These are discussed in the WAGER TESTING tutorial.
Now, make sure that your settings, just discussed are all "NO", the number of races is 1000, and that you are testing "MOST RECENT TO OLDEST PROGRAM FILE". If these settings are correct, select the ANALYZE button. The results are shown and discussed below.
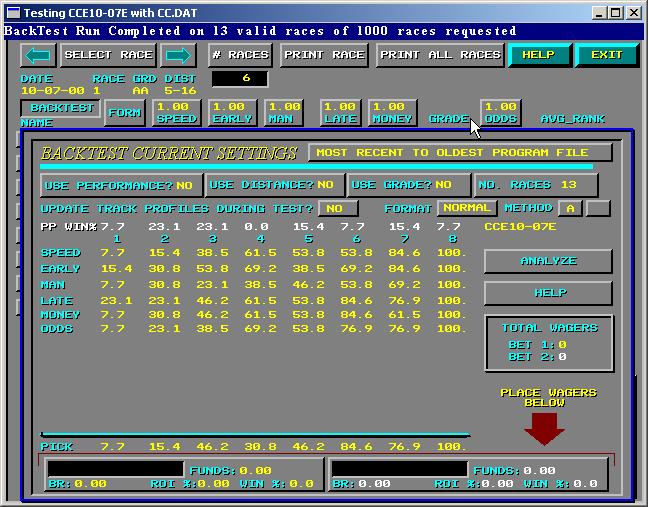
Figure 5 - Backtest Results "A" Method
A lot of figures show up, but what do they all mean? First, in the NO. RACES button, we get 13, which means that even though we asked for 1000 races, QuickDog only found 13. The other data shown is the actual statistical information which QuickDog calculated based on those 13 races. What do these numbers mean?
The meanings depend on the "METHOD" setting, which appears just below the "NO. RACES" button on the upper right of the pop-up. Note the current METHOD is "A". The "A" method calculates "success" percentages for each of the Handicapping Factors (SPEED, EARLY, MAN, LATE, MONEY, and ODDS) based upon the scores which QuickDog calculates for each using the STANDARD METHOD (or whichever method you are currently backtesting). In addition there is an overall score shown as PICK at the bottom of the table.
In the example above, under column 1 is the percent of the time that QuickDog's first pick finished FIRST. Note that for SPEED, MAN, MONEY, and ODDS this figure is 7.7 percent. Now, what is the chance of you picking a dog to win the race, simply by throwing darts at a dart board of 8 picks? The answer is 12.5%. Turns out, for just these 13 races, these 4 indicators were not reliable to pick the first dog across the finish line.
Now, look at EARLY (which is early speed). It's value is 15.4% which is slightly above 12.5%, again not too significant an indicator.
Finally, LATE (which is late speed) show up at 23.1%, nearly twice as often as 12.5%.
Now, find the FORMAT button which says "NORMAL" on it. Click this button and QuickDog will show you the "DELTA" values which show you how much better (positive numbers) or worse (negative numbers) QuickDog is than simply picking using your dartboard.
What can we conclude? First, we should admit that 13 races doesn't give us too much of an indication one way or the other and that we need more races. But, assuming we had a large number of races, perhaps 100 or even 500, we would have to admit that only two indicators for this method are important for this track. Are these the same at other tracks? We can't tell unless we Backtest those tracks.
Ok, on to column 2. This column gives the percent of the time that QuickDog's 2nd pick did actually finish 1st or 2nd. If we look at pure chance, this value would be 25%. Once again we can see which factors show an improvement of pure chance.
Column 3 gives the percent of the time that QuickDog's 3rd pick finishes 1st, 2nd, or 3rd. Do you see a pattern to what Method "A" is showing? For column 3, the pure chance is 37.5%. And so on, for column 4 which gives us QuickDog's result for picking the 4th dog to come in 1st, 2nd, 3rd, or 4th.
If a particular indicator, for example, LATE continually provides a better than chance result, this might show you that late speed (as determined by QuickDog) is a relevant factor at this track.
A final note for Method "A" - note that all values under column 8 are 100% which means that like everybody else, QuickDog can pick a dog from every race that will finish 8 or better.
Now, click on the "A" box to change the METHOD to Method "B". A "1" pops up in the empty button next door. Select ANALYZE once again.
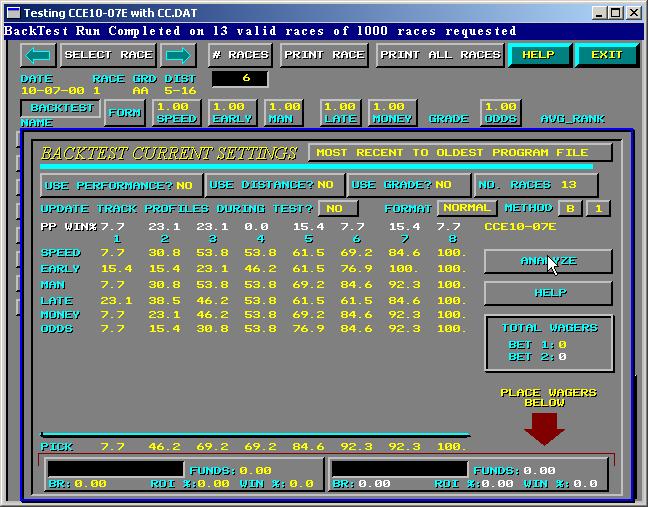
Figure 6 - Backtest Method "B"
The results for Method B depend on what number we enter in the button next door to the METHOD "B" button. In this example, we entered a "1", which tells QuickDog to look at the races based on the factors and list the percent of the time that QuickDog's number 1 pick finished 1st (column 1), the number 1 pick finished 2nd or better (column 2), finished 3rd or better (column 3), finished 4th or better (column 4), etc.
By looking at the EARLY row, for example, we can tell that the 1st QuickDog pick by EARLY speed never finished worse than 7th.
We can also tell, because column 3 equals column 4 for SPEED and MAN, that QuickDog's 1st pick for these two factors never finished in 4th place.
Does this data mean anything? Well, once again, there are not enough races considered to draw any statistical meaning. This tutorial is only showing you how to use the backtest feature.
If we now change the number "1" to "2" or "3" or "4", and ANALYZE, the results will indicate how often QuickDog's 2nd or 3rd or 4th (depending on what you enter) finishes 1st, 1st or 2nd, 1st, 2nd, or 3rd, etc.
You might hope that your method maximizes the number of times your 1st pick comes in 1st and minimizes the number of times your 8th dog comes in first. If this trend isn't present, then this method may not be useful at your track, or you need to TUNE it using the WEIGHTING FACTORS. See the HELP on WEIGHTING FACTORS (Weightings). But, keep in mind, the number of times QuickDog's first pick comes in first may not even be important to you. You would rather know how often your top 5 Trifecta Box costing $60 comes in at your track. The Wager Testing feature will show you this and more!
Oh, a couple more things - the PICK row gives the overall QuickDog Pick using the score for all Handicapping Factors of the method. And the PP Win% simply shows how many times a particular "box" won the race. The PP Win% is not used by QuickDog and is for information only.
Copyright 2001 JONSOG associates, Inc. PO Box 911, Lyle, WA 98635 Last Changed - 05/10/2003